Home QGraph
High Velocity Data Ingestion: Lessons We Learnt
Summary
This article describes our experience at QGraph about high velocity data ingestion.
It describes how we built version 1 of our data ingestion system (in a day), and how
we evolved it over the next 2 years in response to increasingly high velocity of data.
The actions we took look simple in retrospect, but they were not obvious when
we were implementing them. There were many steps which we took, only to roll them back.
If you think we are missing some basic ideas for the improvement, kindly contact me.
The problem statement
Various of QGraph SDKs (for android, iOS and web) send semi structured data about the
users to QGraph web servers. Data is sent in JSON format via HTTP POST requests. Data is typically
small in size: usually smaller than 1KB, though sometimes it can go as high as 20KB. We want the data
to be available for use for other systems within a matter of seconds.
A typical POST body looks like this:
{
    "userId": 123123123123,
    "appId": 63adf2dadf2d344,
    "name": "Vivek Pandey",
    "hobbies": ["Chess", "Mathematics", "Algorithms"]
}
We decided the ingestion system needs to write this data to MongoDB1.

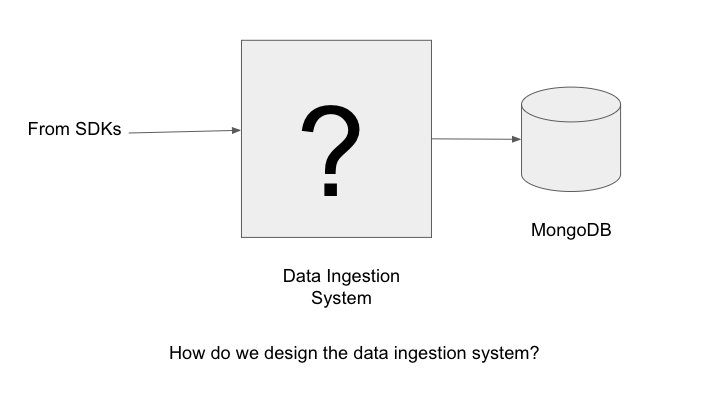
How do we design and implement a high performance and low cost architecture to achieve this?
What follows is the description of the process of iterative improvement that we
followed for over an year to make ever improved data ingestion system.
The beginning: no traffic, no complexity

We were just starting out and had no visibility into scaling issues that may arise in
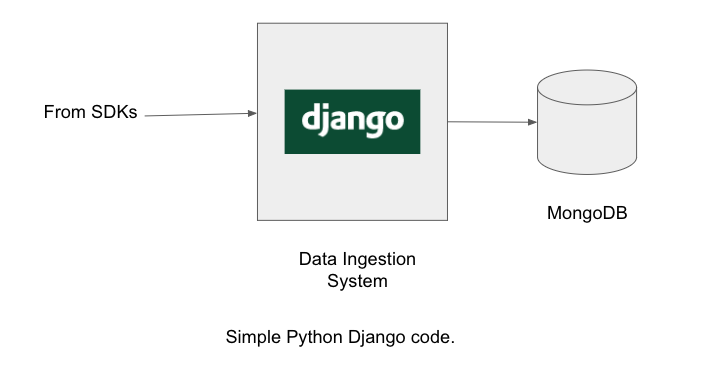
future. We did not try to predict them either. We wrote a simple server in Django
REST framework, which connected to MongoDB on each request and fired a query to
store the data.
This served us well during initial testing, however things started to go bad as soon
as the rubber hit the road, i.e. the first client went live.
The rubber hit the road

We saw that in times of peak load, data ingestion was not working properly: it was
taking too long to connect to MongoDB and requests were timing out. This was leading
to data loss.
This is a common problem: During high load, all the components in the chain
are stressed, and the one of the component gives in. One could make the weakest link
stronger, but one can do better: introduce a buffer before the weakest component.
Since in our case, it was the MongoDB which was unable to ingest data fast enough, we decided
to put a messaging queue before MongoDB system. Enter Kafka.

Why Kafka? Well Google searches led us to believe this is the tool most suitable for
our purposes. And we also felt that the fact that we use Kafka will make prospective
employees to want to us to join us.
Hah.
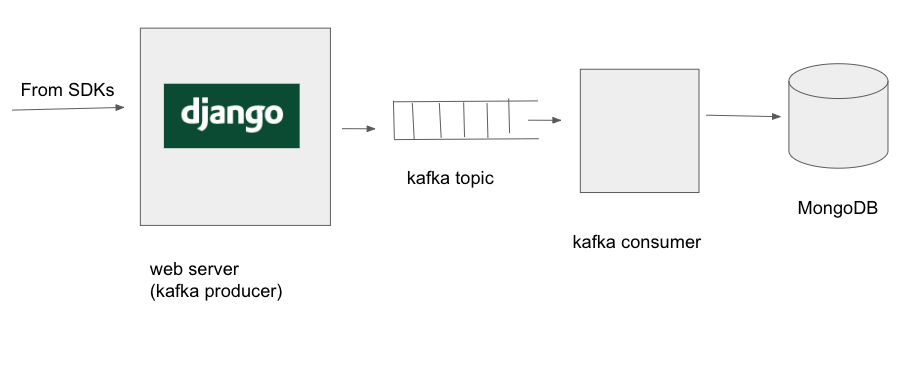
So, now, the webserver wrote data to kafka topics. And we wrote a kafka consumer which
read the data from the kafka topic and wrote it MongoDB. So, the architecture now
looked like the following:

Why is writing to kafka better than writing to MongoDB? It is because when you are
writing to kafka, you are writing to the end of a file, which is hightly efficient.
Unlike MongoDB (or any database), there are no indexes to be maintained, no
degragmentations to be compacted, and no queries to be answered. Produces produce
and consumers consumer, that is all.
Now, at the times of peak loads, requests get stored in Kafka while the consumer,
limited by the MongoDB, processes them. Thus, at peak time, it takes a few minutes
before the data gets to MongoDB. However, it is fine, because these peaks
themselves last only a few seconds or minutes, and occur only a few times a day.
We spent some time in choosing optimal settings for kakfa. In particular, we set the
batch size, maximum latency and compression as per our needs.
Car Connection Pooling please!
OK. This is fairly basic. We were not using connection pooling so far. For each
update to the database, a connection was opened, request was made and the connection
was closed. We moved to connection pooling, and this led to slight decrease in
CPU utilization of mongo machine, and a large decrease in the default mongo logging
(which logs one line per connection open/close).
Back it up
Once we had a few clients, we started worrying about data loss. What if the Mongo machine
went down, never to come up again? Or else we somehow corrupted the data beyond repair?
Or if, by mistake someone deleted an entire customer's database?
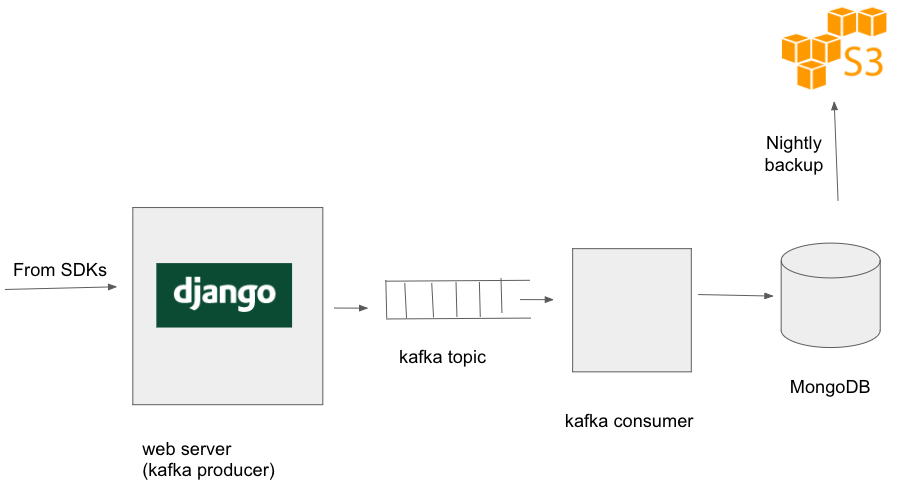
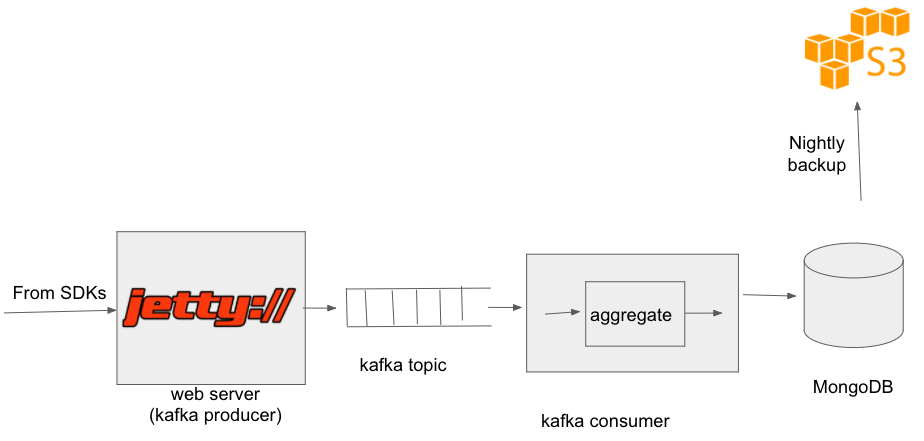
To guard against such occurrences, we started taking daily backups of our database
to S3. As time went, daily backups became too heavy, and then we started daily
incremental backups, i.e. we take backup of only that part of the data which
is either new or modified. This is what the architecture looks like after this.

Move to Java for web servers
With using Kafka as a buffer between the web server and mongo machines, the system
was quite stable. However, we were using a fleet of webservers, and thought we could
bring down the fleet size by using Java as the language rather than Python. Python
had helped us getting everything running quickly, but now we required more performance.
Thankfully, the web server code was pretty straightforward: just read the post body,
do some simple validations and put a message in a kafka topic. We chose Jetty as
the framework of choice (partly because in my previous company people had worked on
Jetty based web servers). As we had expected (and described in detail
here),
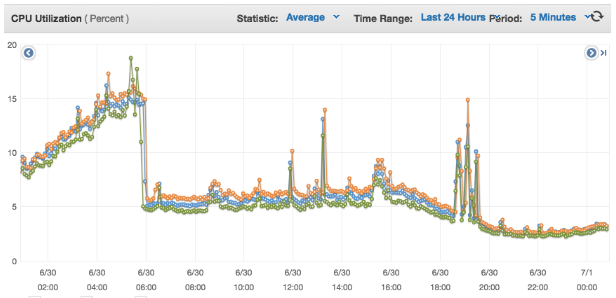
we reduced CPU utilization of our web servers drastically:

Now, our architecture looked like:

Things went fine for a few months, when we started facing a fresh problem. The
problem was that periodically, kafka consumer was way (sometimes hours) behind
the producer, i.e. we were unable to put data to MongoDB as the rate at which
was arriving. Again, this happened when there was a spike in the incoming
data rate. It usually happened when a large client sent push notifications to
all their users. In that case a large number of users open the app within a
small window of time, causing an increase in the event rate on our servers. Couple
it with the fact that MongoDB could be getting queried by some other subsystems
while it is ingesting data at a high rate. In such a situation, both the ingestion
and the querying came to a standstill.
We could always move to mongo machines with more memory (so that more indexes
could be in-memory), but turns out that there was a software solution to keep
us going:
Aggregating the queries
We realized that bulk operations to mongo were more performant that individual
operations.
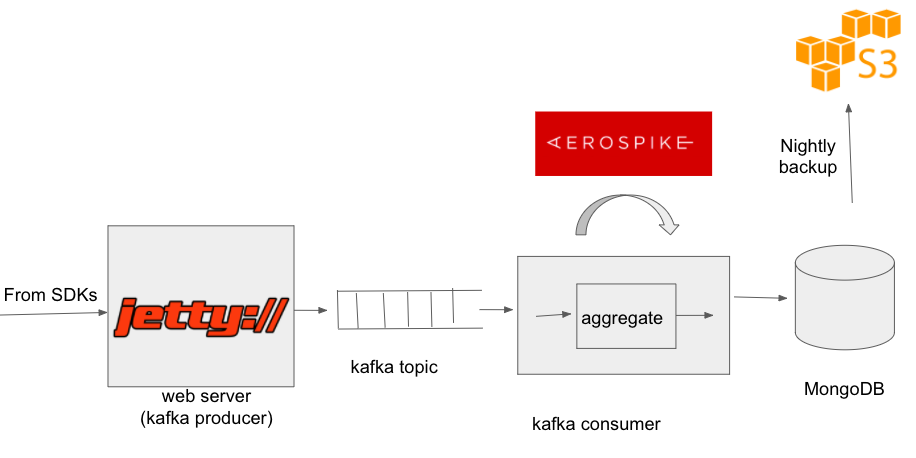
We wrote a module, called mongo query aggregator, which provide similar
interface to other mongo drivers, but which aggregated the write queries and fired
them to mongo either when threshold number of queries were collected or when a threshold
amount of time (few hundres of milliseconds) had elapsed. This again reduced CPU
utilization of mongo and mongo was able to ingestion spiked data in a graceful way.
After introducing query aggregator, our architecture looked like this:

We released our mongo query aggregator on github. You can access it
here
To install it, simply run
pip install moquag
on your system
Caching layer before MongoDB
As you may have noticed till now: MongoDB has been continually the weak point all
along. That is expected, since MongoDB is a busy system: on the one hand it is ingesting
data in realtime, on the other hand it is being queried by dozens of other subsystems.
Thus, a large part of the effort is around reducing the laod to MongoDB. We have done
a lot of work around reducing the readread query workload of MongoDB, but that is a separate
topic.
A few months after the previous change, as the ingestion rate and query rate increased
again we started having the kafka lag problems again: at times, consumer would be behind
the producer by as much as a few hours. Incidence of such problems rose from infrequent (once
every four weeks) to mildly frequent (once a week). At the time of large read queries,
the ingestion system would be too slow and it would take a lot of time for data
to reach from kafka to MongoDB.
Fortunately, we had a weapon to attack this problem. That weapon is the CS engineers'
favorite weapon: Caching.

We realized that a lot of data that we were getting was repeated data. For a given
user, we got his profile information as many times as he did some action. The profile
information that we got contained information like the name, email or the city
of the user. This information tends to change very slowly, but we wrote it to MongoDB
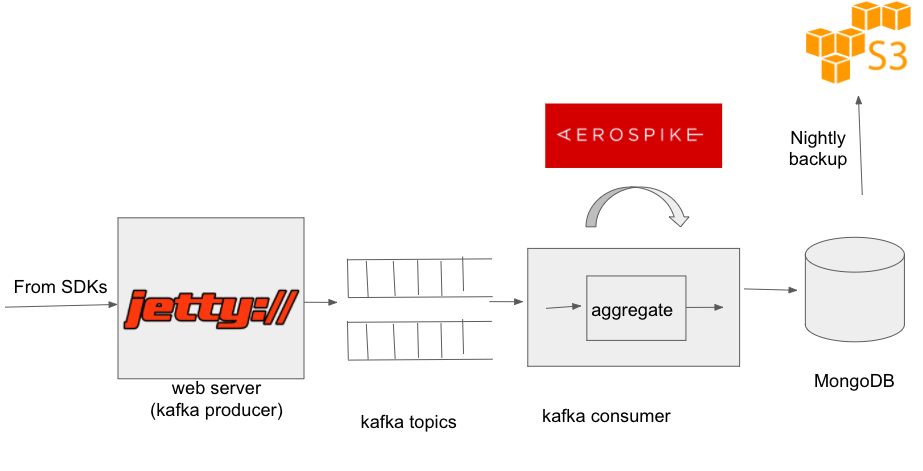
repeatedly. To reduce the query rate to MongoDB, we put an aerospike cache in front of
MongoDB. As we write some information to MongoDB, we also wrote it to aerospike. However,
before writing info to MongoDB, we checked in aerospike if the same information
was present already. If yes, we did not bother to write the information in MongoDB.
This optimization reduced the MongoDB queries by around 60%.

Along the way we also realized that not all data is equal. For some types of data
it was important to get it to MongoDB as soon as possible. Other type of data could wait.
Thus, we started from putting data in two different queues from the producer. When
there was delay in getting data to Mongo, we could shutdown the consumption of lower
priority queue, thus ensuring that high priority data reaches mongo on time. Once the
peak traffic was over, we would start consuming the lower priority queue.

This is data ingestion story till now. Our system continues to evolve.
Upcoming action items and problems to be resolved
Following are some action items we can take up in future to further optimize
our data ingestion system
-
Use auto scaling: Boot more web server machines during heavy load and shut them
down during low load. With AWS supporting
per second pricing rather than hourly pricing, this idea will be even more effective.
-
Currently, our Jetty server does some preliminary validation on the incoming
data, and post this validation, puts the message in the kafka queue. In the
interest of lower latencies, we can put the POST body directly on the kafka
queue (without validation). The consumer can take care of validaton and reject
the message if it fails validation. Further, if the only job of web server is to put the POST body to
a queue, do we need Jetty for that? Can we have an nginx module to do that? If
that is possible, our web server will be even more efficient and low latency.
-
While most of the requests have response times of <2ms, averge respones times
of our servers are >10ms. The reason is that some requests arbitrarily take
a large amount of time. We have not yet been able to figure why is that so.
Data ingestion system began with a simple 30 line django code, and by now it has
expanded to thousands of lines of code, with multiple systems running on
various machines. When we began we did not know how the system will evolve, and
we did not try to predict the problems that would happen. However, we kept our
eyes and ears open and solved the problem as they came.
Footnotes
1. Yes, I know MongoDB can lose data. I know I should use MySQL. Thanks for your concern.
