Hot off the press: App is now approved.
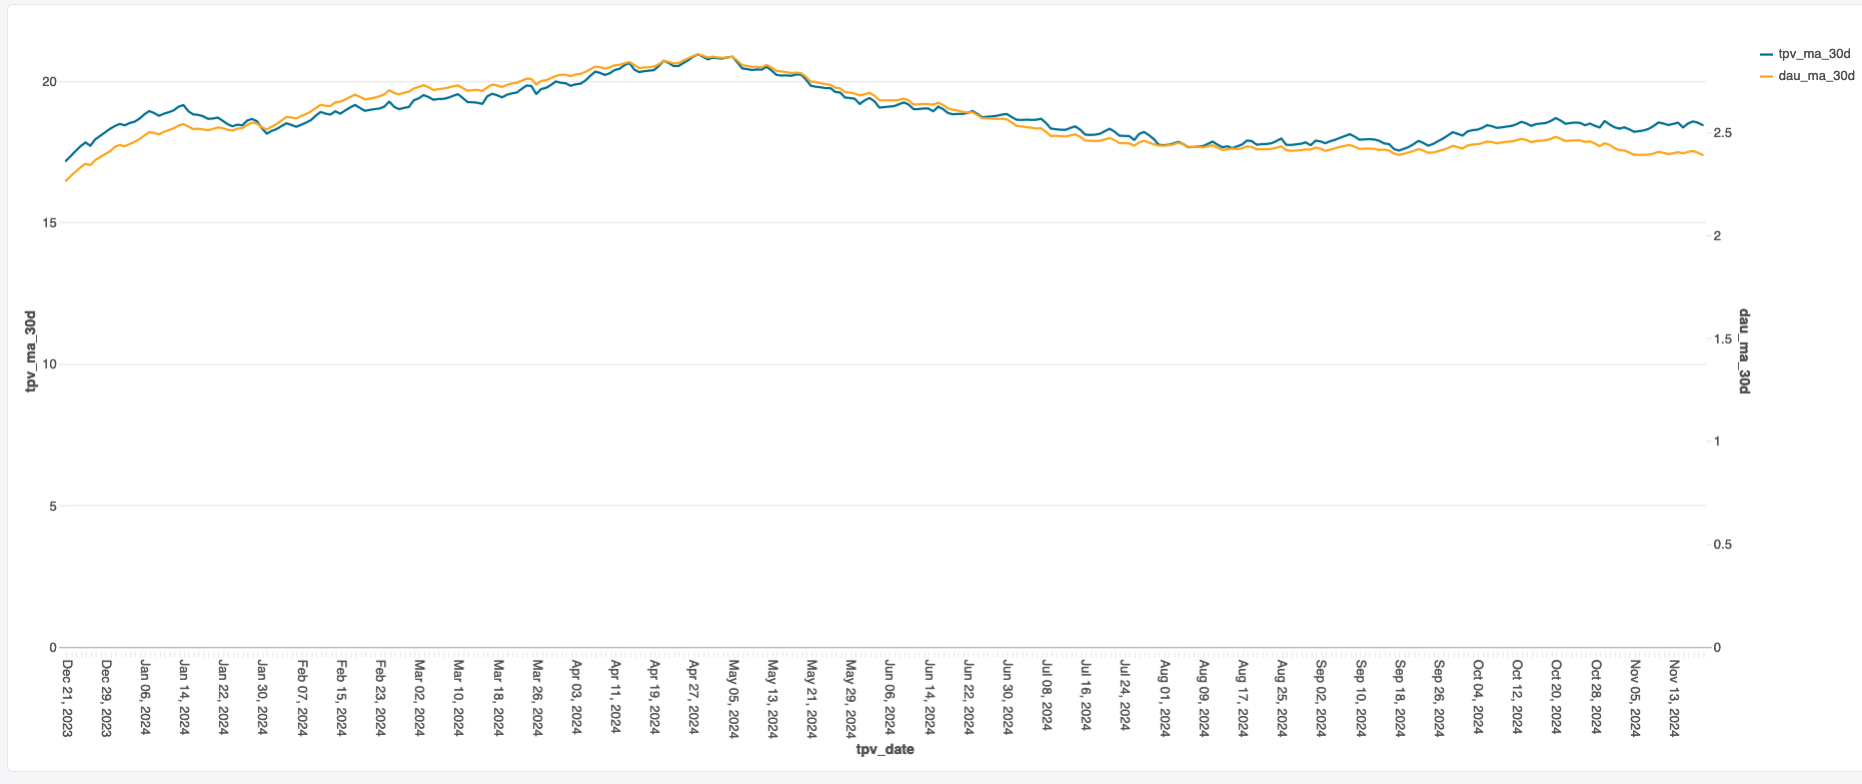 Above is 30 day MA of TPV over last 1 year. We hit a bottom mid Sept, then we rose till mid October, and we are static since then. Lately (past 1 week), a bit of growth has been happening.
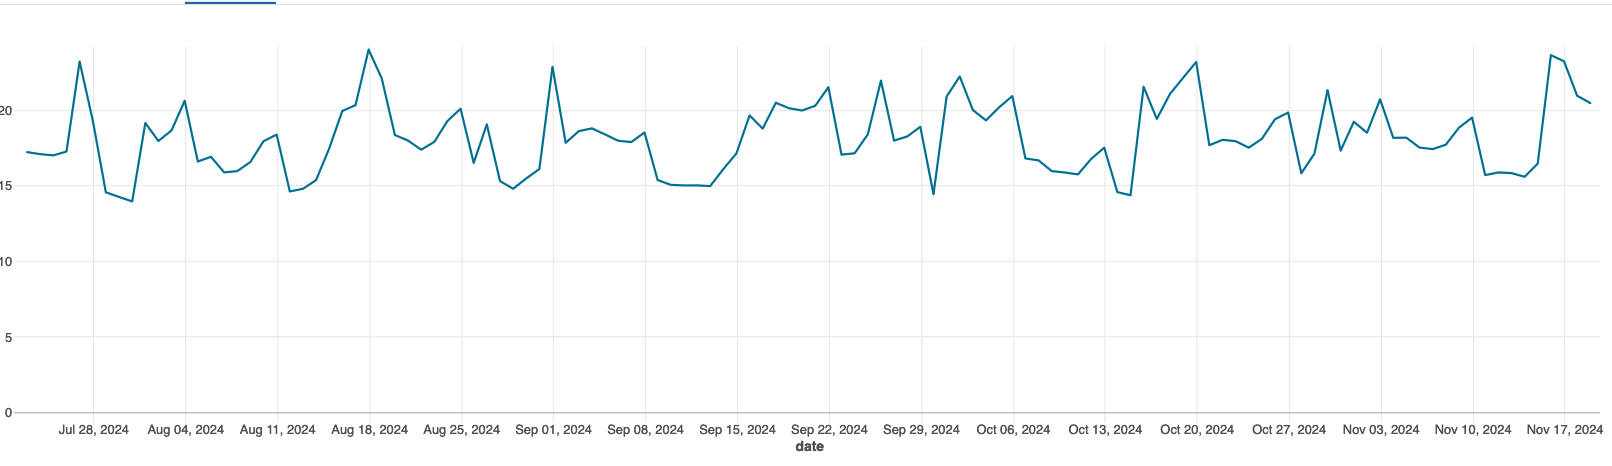 On Nov 16, we hit highest daily TPV since August 18. The reason is that we tend to have higher TPV on weekends and tend to have higher TPV at the beginning of cycles (when users have max limits). Nov 16 had both these properties. Post Aug 18 there were other days when this had happened, but TPV did not go as high, so it is an indication that business is slowly increasing.
Dynamic due date has gone live. Here is the distribution of users on various cycles
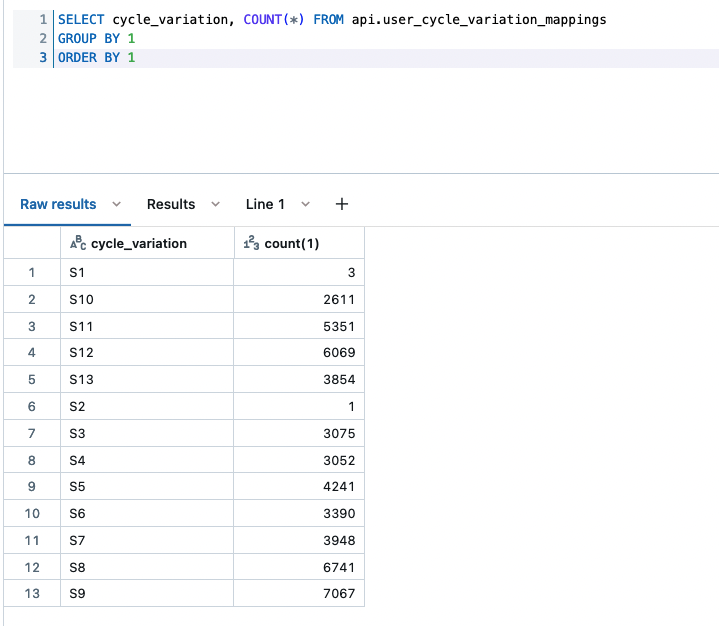
All other users are on variation S1. So, overall, around 50K users are on variations other than S1.
Himanshu has a dashboard related to these metrics.Himanshu: Please use databrick and get away from metabase/redshift. Team - we will get rid of metabase, redshift, powerview, clevertap and appsflyer. You have been warned. We have some track record of getting deprecations done - jupiter notebooks are mostly over, revenueroll is gone, pageduty is going away (Thanks Shoan!).If you needed a handy reference on what are the end dates of each variation, here is a handy reference:
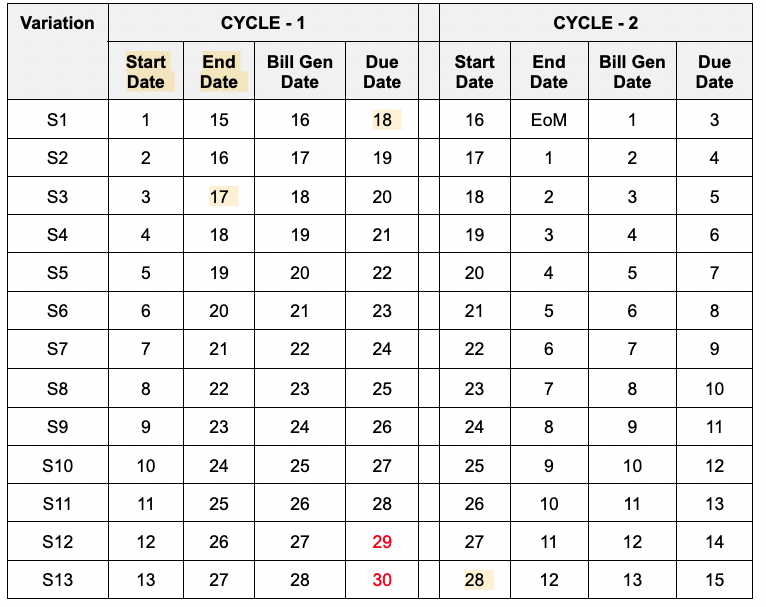
More details are here.
In batch 1, we had asked ~100K users to adopt one of the newer cycles, and ~46K of them did. In batch 2, we have again asked ~100K users to adopt one of the newer cycles, and ~22K of them have adopted.
Since 18th, DDD is live for new users as well. For NU, if they are doing their first transaction on date D, cycle end date is D + 5 for 1/3 of them, D + 10 for another 1/3 of them and D + 15 for another 1/3. Earlier we had considered that cycle end date for all NU should be D + 15. However, we know that amongst NU, delinquency of users whose bill is due soon (like within 5 days of first transaction) is lower than the users whose bill is due later (like more than 10 days of first transaction). Surmised reason for this phenomenon is that NU are not clear on what Simpl/BNPL is, and if due date is very close to their first transaction, they remember the transaction and make the payment. Longer the difference between first transaction and first repayment date, more likely they are to forget or get confused that they got some free coupon.
We will see the delinquency and retention of the three cohorts and then we may take a call retain only one of the experiments.
This is the largest undertaking in last 3 years. PL is what we do and we have modified the system in a foundational way. We were able to meet the planned timelines and on the aggregate it has been smooth execution by the team. So, thanks everyone. I'll check with Nitya if we can go for a dinner somehwere. Dinner should be fine, it is the Goa trip and the like that we need to avoid ;)
DDD implementation was not entirely smooth. We know of at least two major problems that have happened so far.
Late application of late finesWhen we made DDD compliant version of late fines, and deployed it for Oct 2nd cycle fines, there was some timezone related logic. On developer's machine timezone was IST, but on our servers timezone was in GMT. As a result of this the intended fine application did not happen on Oct 19 2 AM. Someone from support on Oct 19 at 6 PM noted that fine was not applied on Oct 19 and then bug was fixed and fine was applied by 9 PM. RCA is here.
No one realized the full impact of this at that time. Only much later (early Nov) did we realize that we lost 73L worth of late fees due to late application of fines.
I see it as a lack of monitoring. I am not sure if even the subsequent monitoring is robust enough. I need to work with relevant teams to ensure robust monitoring.
Wrong cycle count in AFS systems: AFS maintains how many cycles a user has transacted in. As a part of DDD, AFS team decided to move cycle rank from one store to another. For that they needed to fill in the cycle rank of users, but the code failed to take into account DDD related nuances properly and inflated the cycle count of around 1M users. Loss due to this was minimal. My take away is that there was lack of testing in the sense that we should pick a few numbers and see their counts.
With tech work over, risk and analysis work starts. In our analysis, we are used to odd/even cycle systems. We will be soon be starting to look at delinquencies in a different manner. We will take an iterative approach - look in a certain way, see if it working out. And change if it is not. It will take some more mmonths to realize business gains, and we will keep you posted.
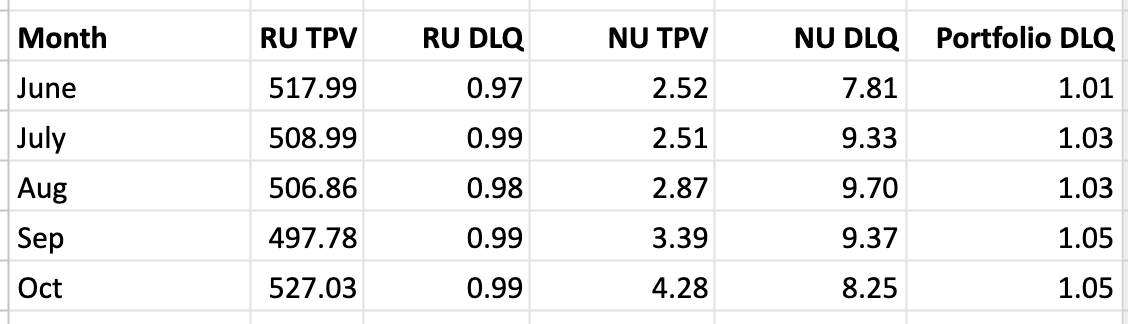
Since July, NU TPV is rising and that is pulling up portfolio DLQ up. I am optimistic that with lowered NU DLQ (likely due to new approval model, myntra experiment and increased Pi3 NU TPV) we will be able to hold portfolio at less than 105 bps in coming months while still providing a decent growth in form of higher NU.
 Pretty harmless, huh?
Well, it is an 845KB image (high resolution), and was downloaded 20M times in last few days, leading to 16TB of data transfer!
Pretty harmless, huh?
Well, it is an 845KB image (high resolution), and was downloaded 20M times in last few days, leading to 16TB of data transfer!
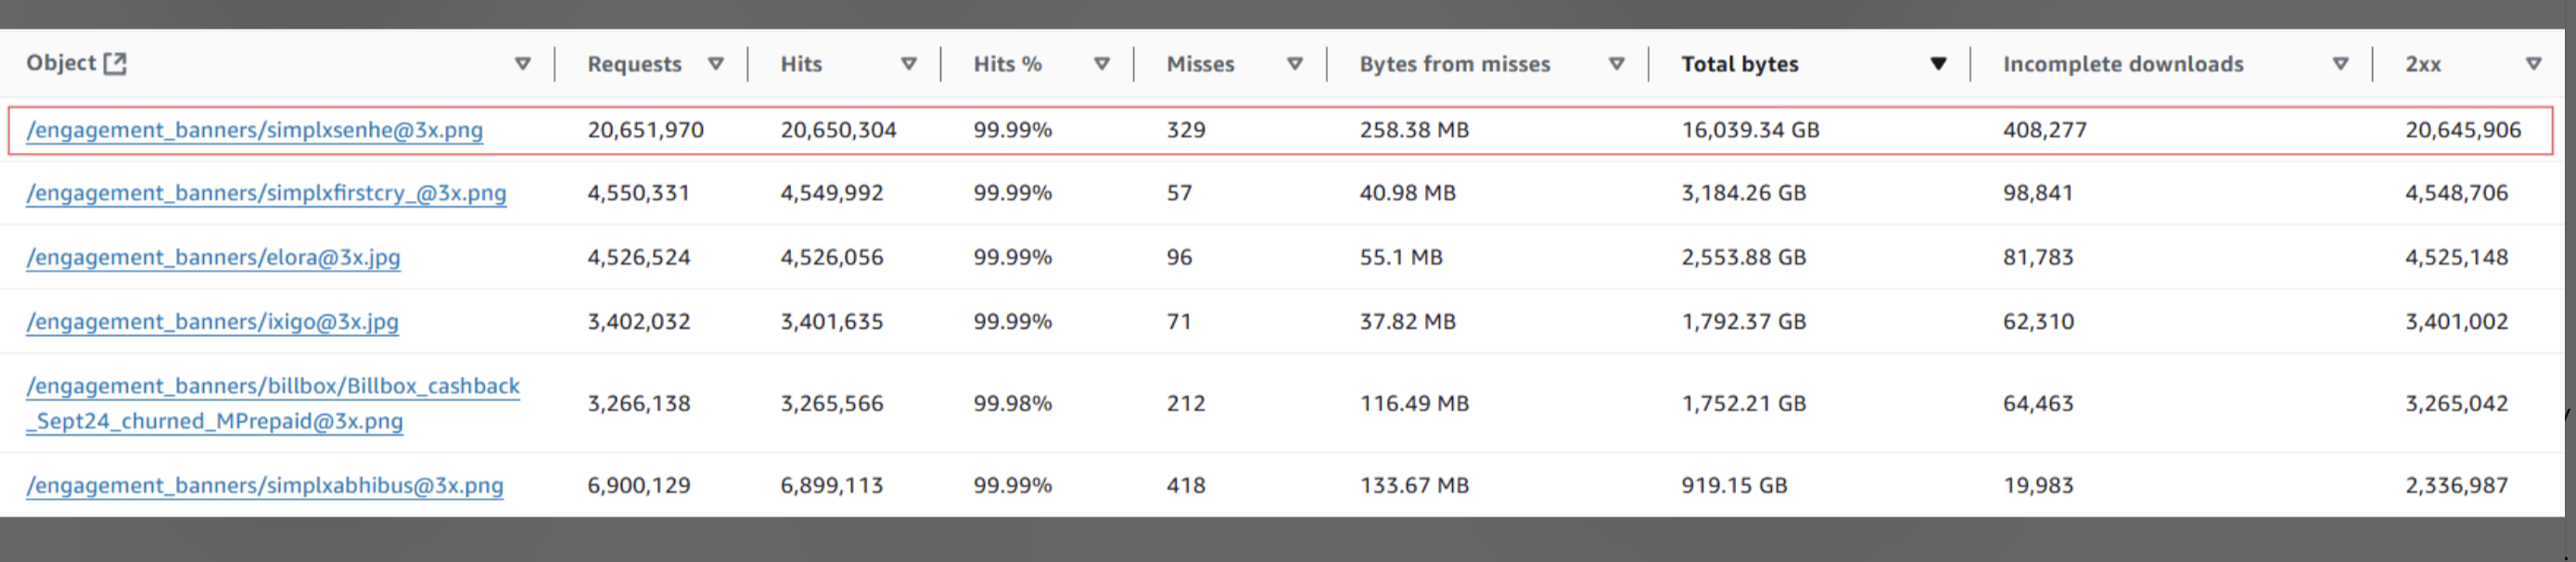
It increased our daily cloudfront costs drastically:
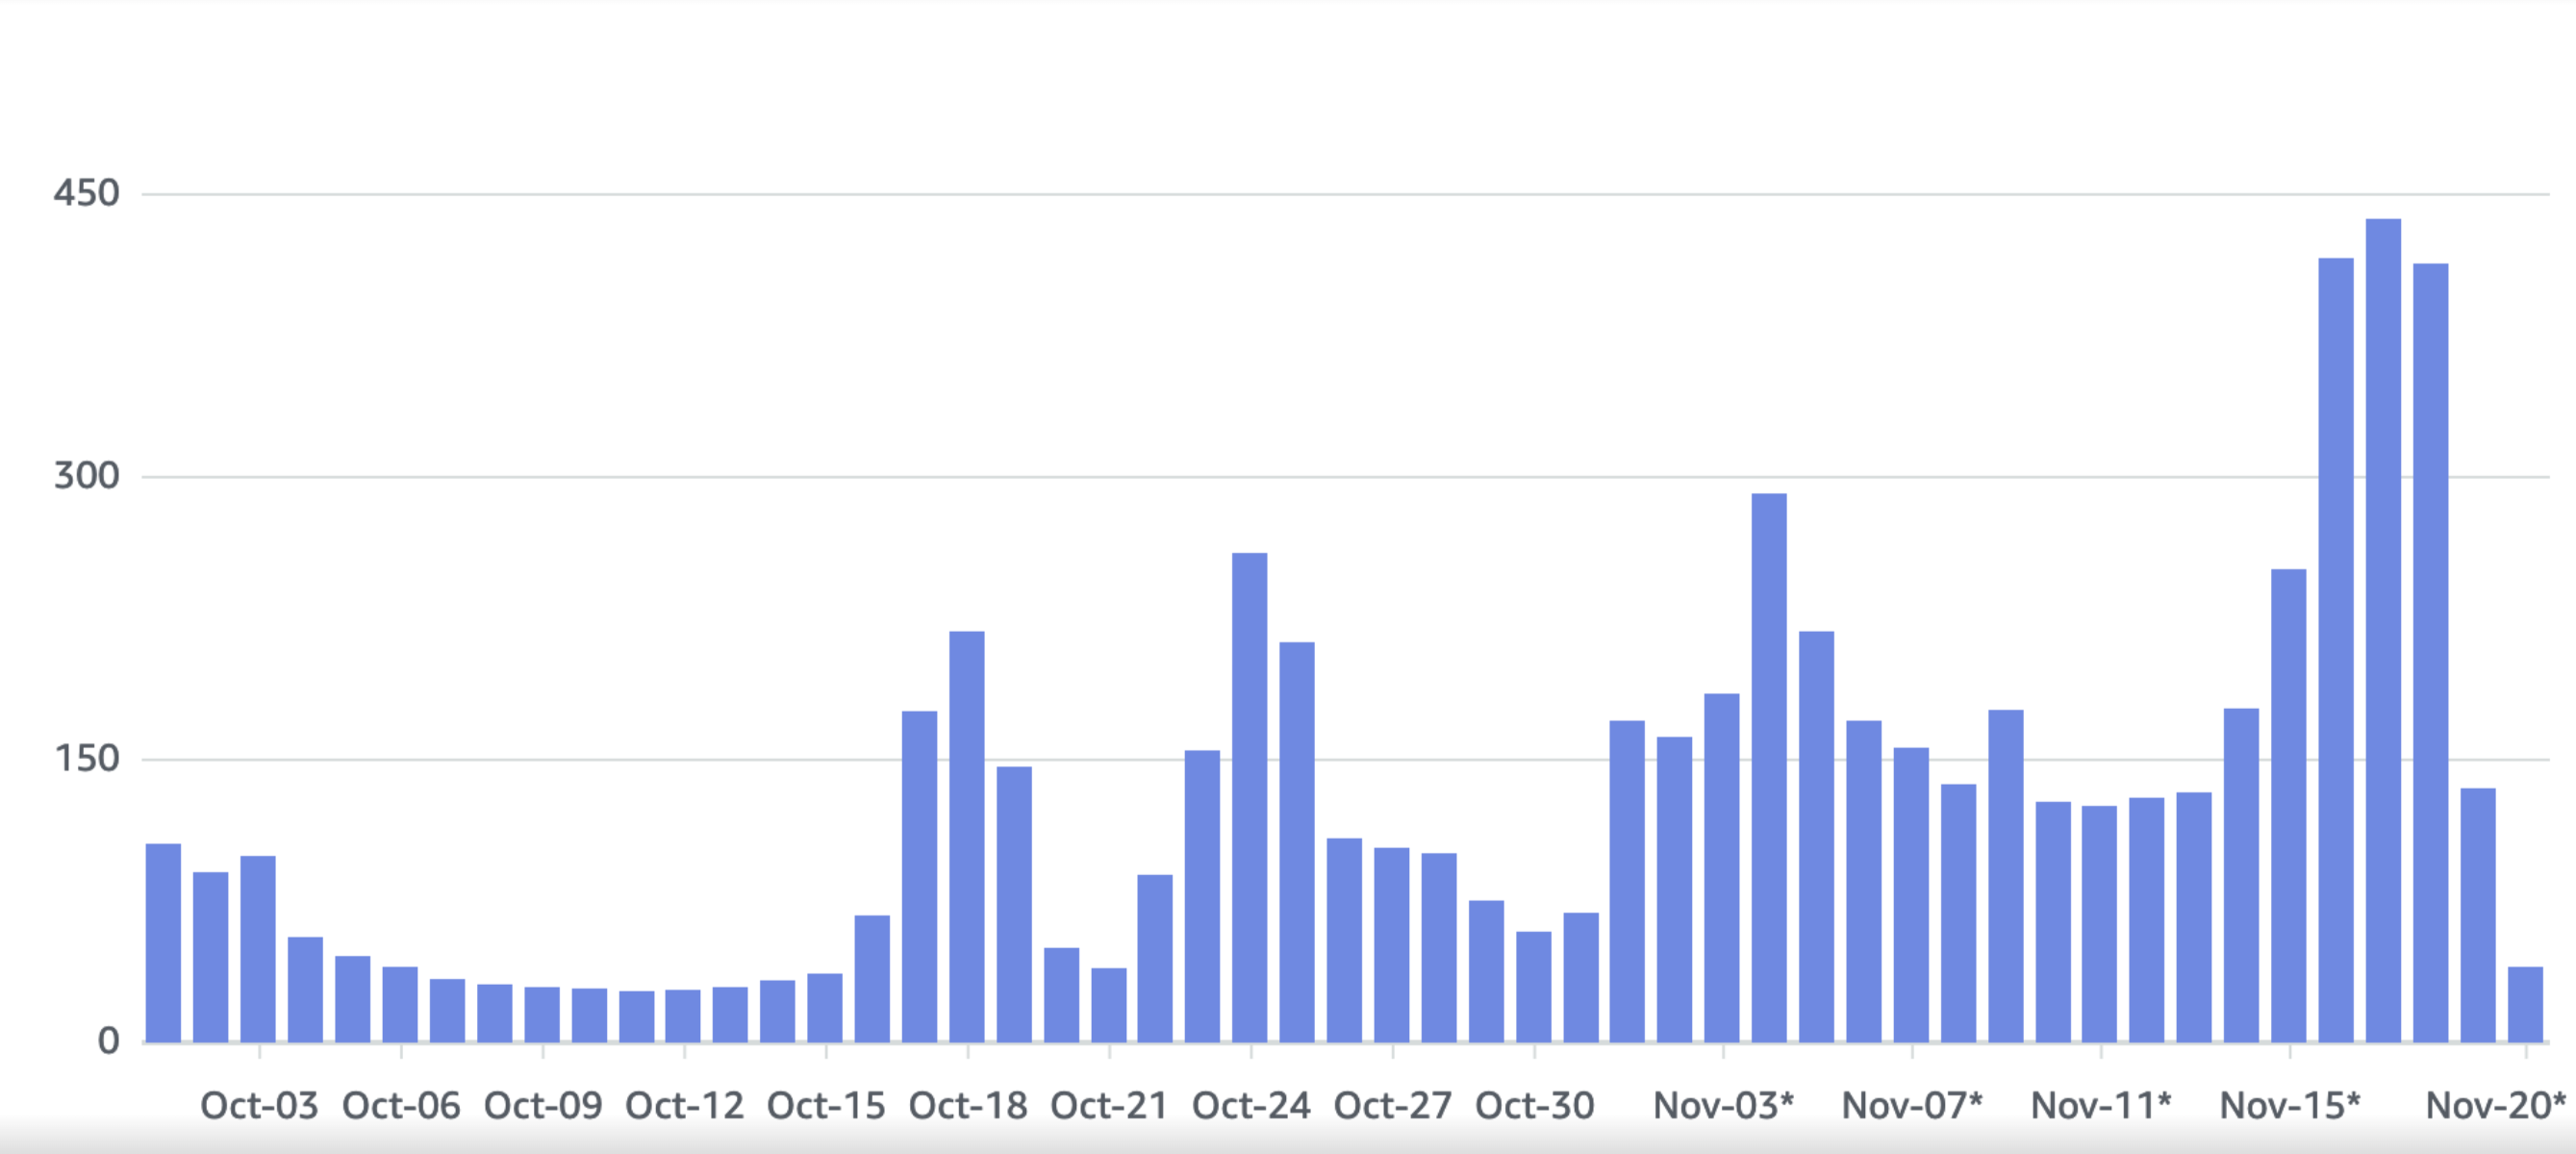 At $400 daily, we were at run rate of $12K a month. That's like Rs 10L which is equivalent a TPV of Rs 10cr at 1% CM3. Whoever is trying to "grow" our business using this image - little do they know what they were doing. Fault is also with tech systems - lack of caching, lack of mechanism to prevent arbitrary size image upload.
Shoan assures me that since then some CDN caching has been implemented and also Farhan has disabled upload of images bigger than 200KB, and as a result, cloud front costs have nosedived apparently, even below their previous levels:
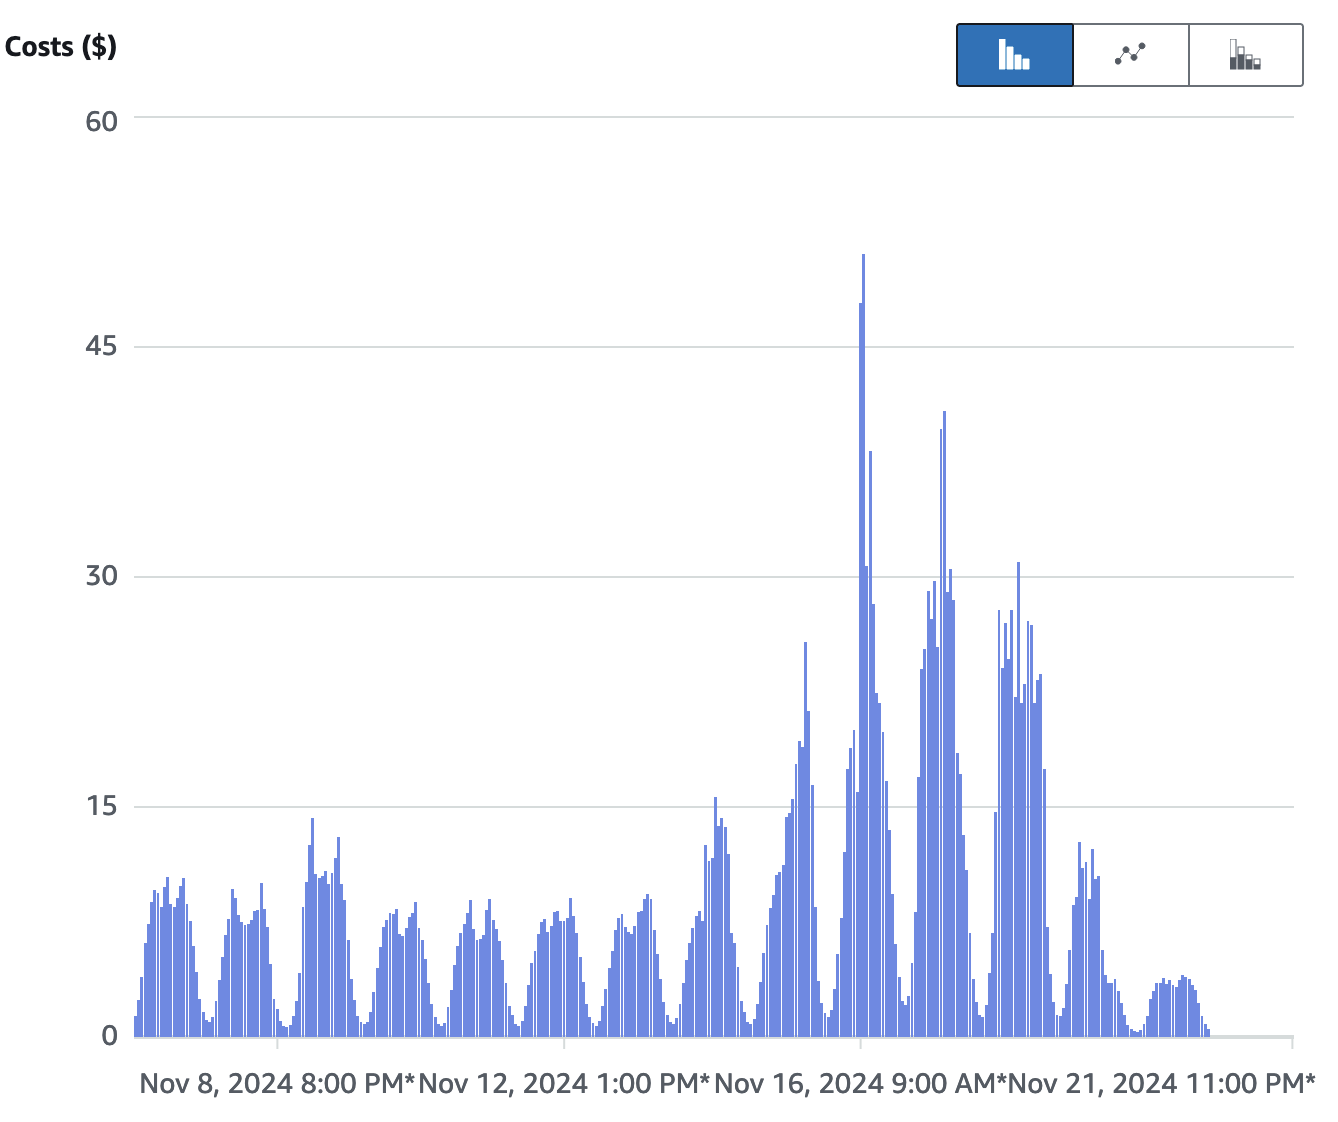 Above is hourly cloudfront cost for last 14 days. For the last 1 day cost is really small compared to what it used to be earlier. When life give lemon to Shoan, he makes lemonade!
In other news, Vikas has made very nice optimisations in databricks, and our usage is well below daily commitment.
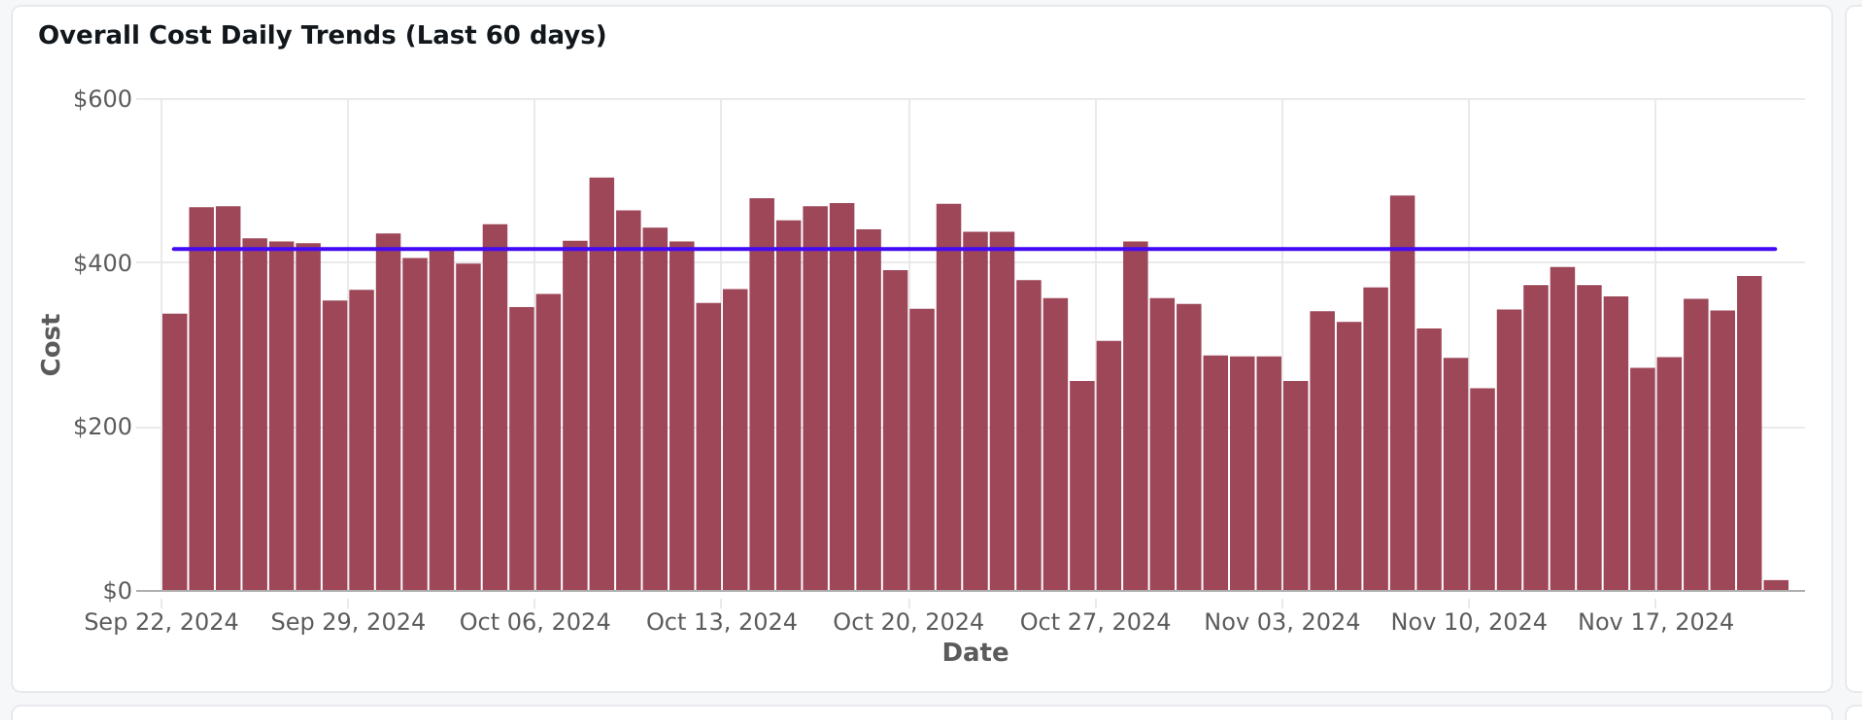 Earlier we were sometimes above the horizontal line and sometimes below, now we are almost always below horizontal line. This is despite us booting
two additional cluster for the DS team. Taste bhi, health bhi!
Earlier we were sometimes above the horizontal line and sometimes below, now we are almost always below horizontal line. This is despite us booting
two additional cluster for the DS team. Taste bhi, health bhi!
As a result of these optimisations, databricks AWS costs are also trending lower. In the diagram below, Nov daily costs are markedly down from September and October.
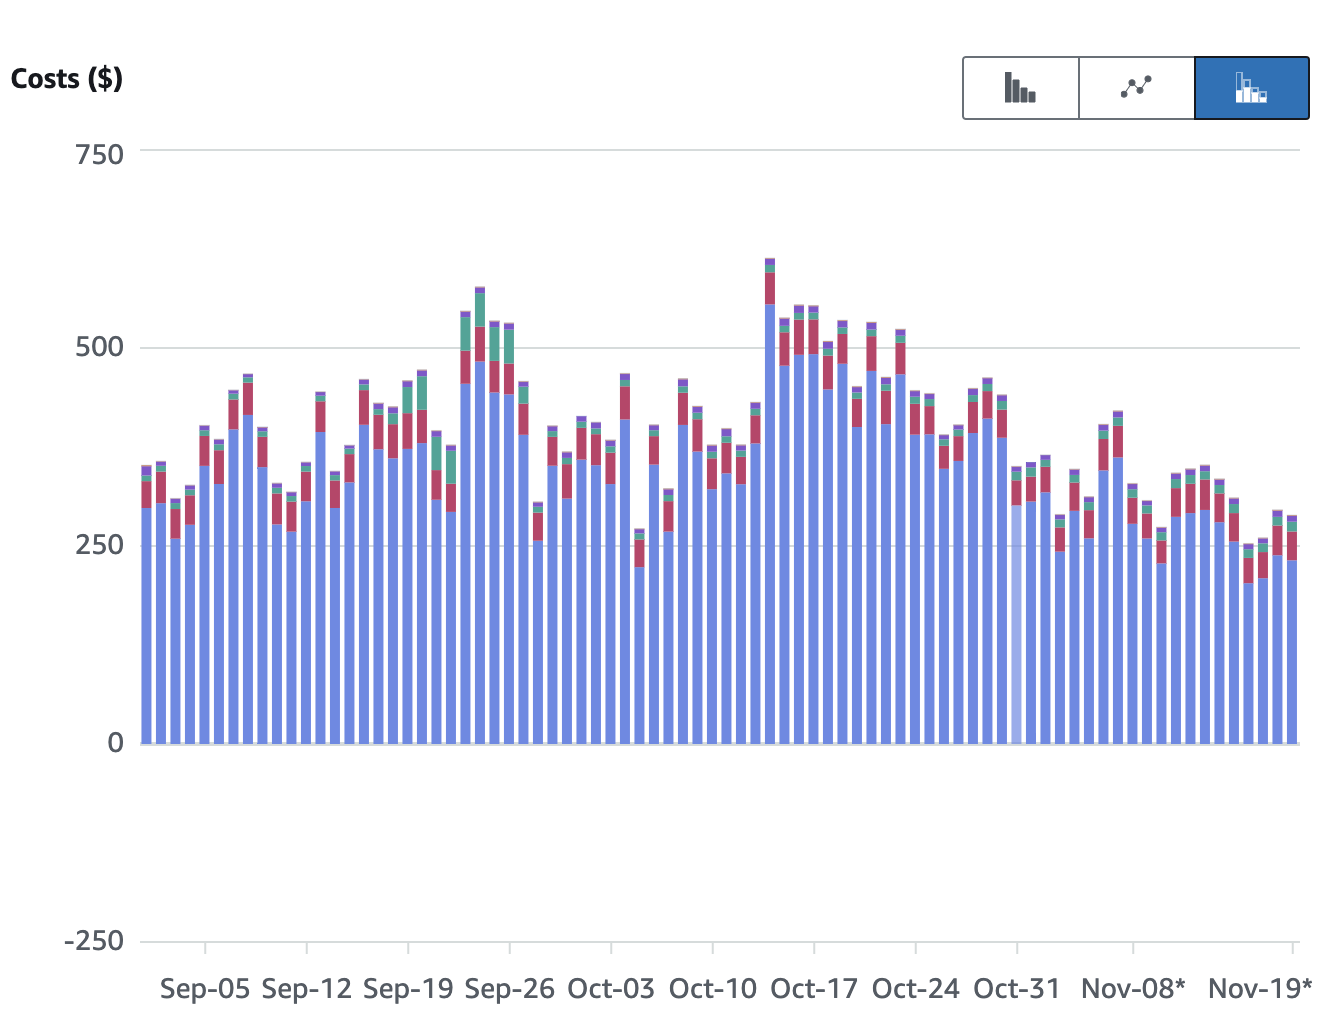 Key is: monitor the metric, find what drives it and optimise. One small change at a time.
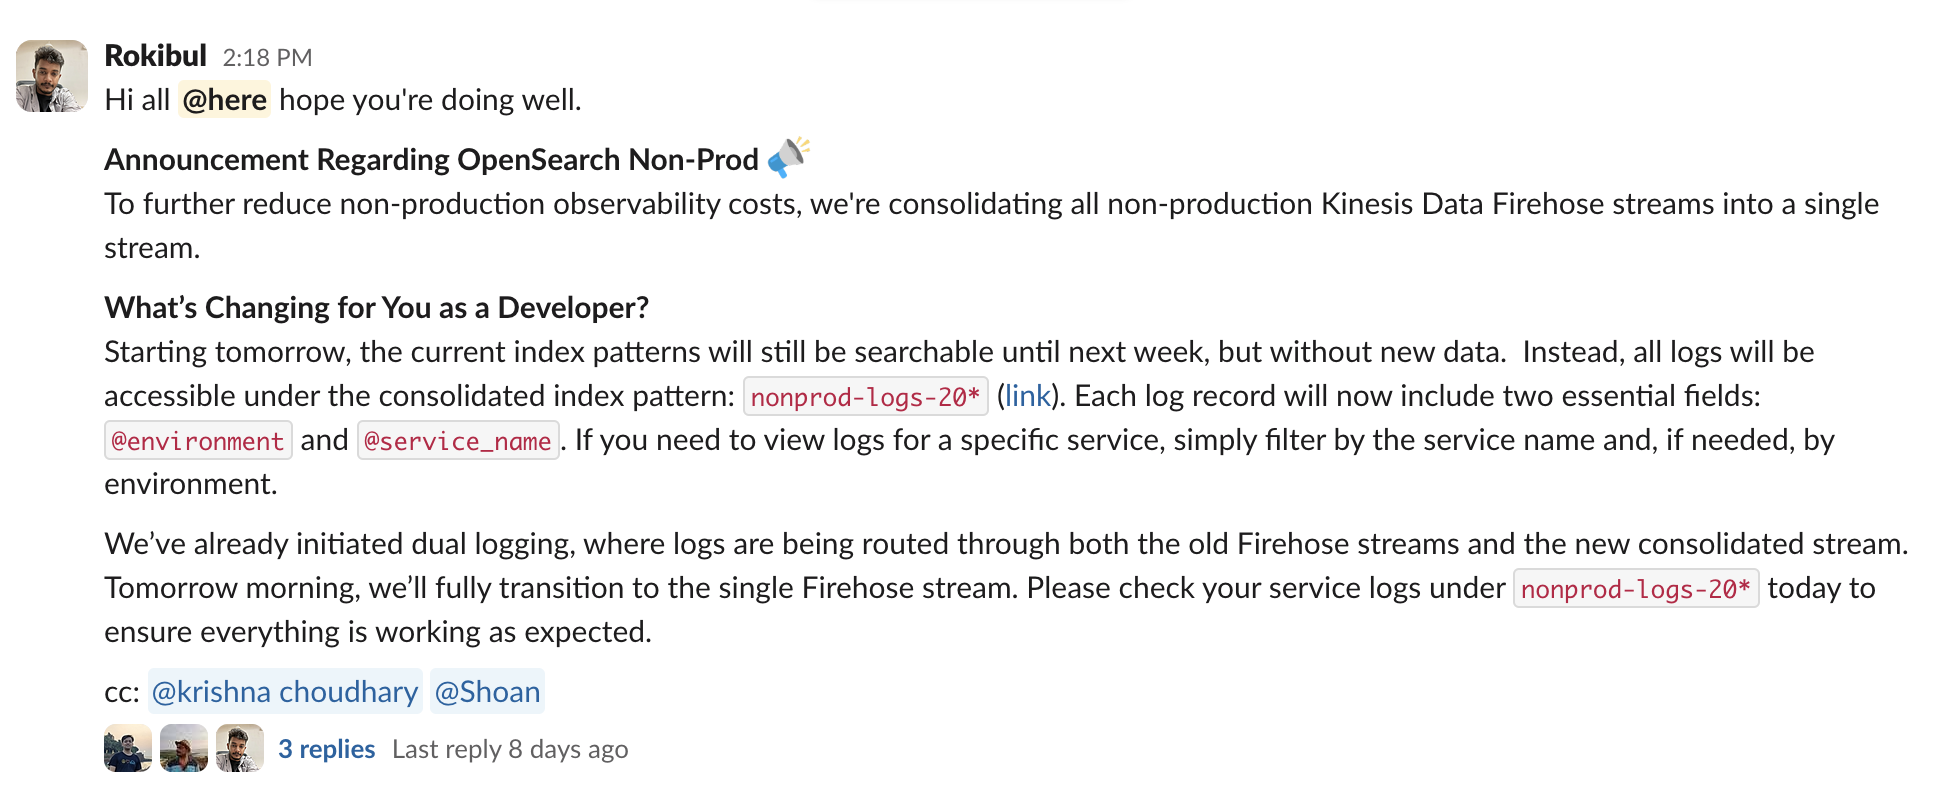
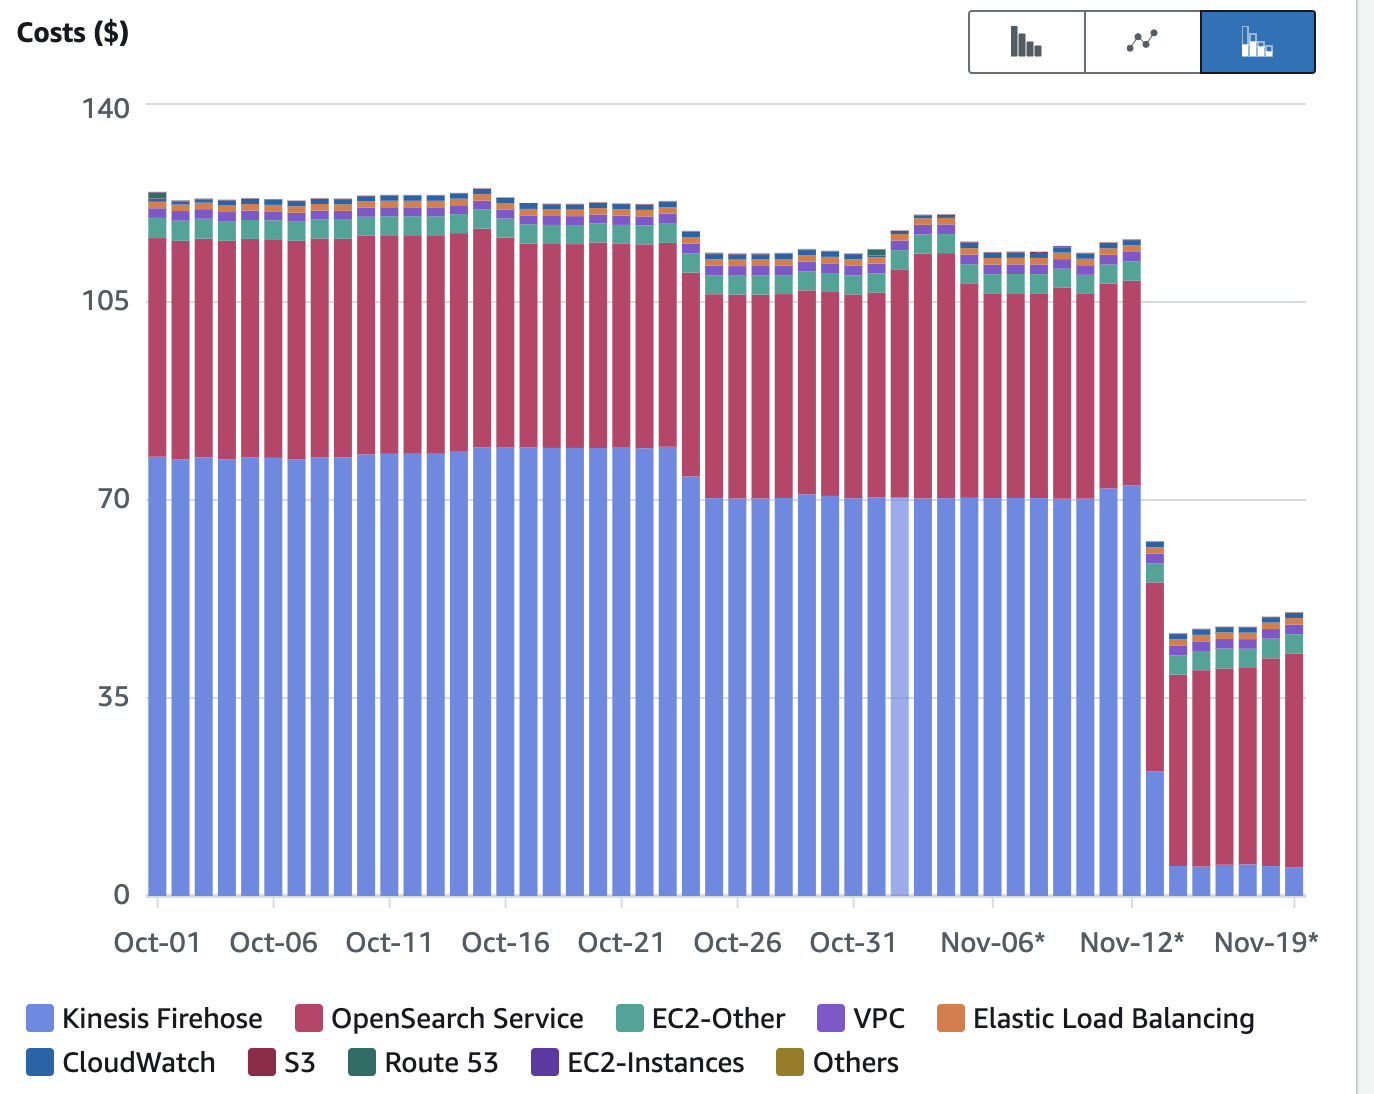
Devops team consolidated all non prod kinesis data to a single stream:
 and we got handsome cost gains of $2K per month!
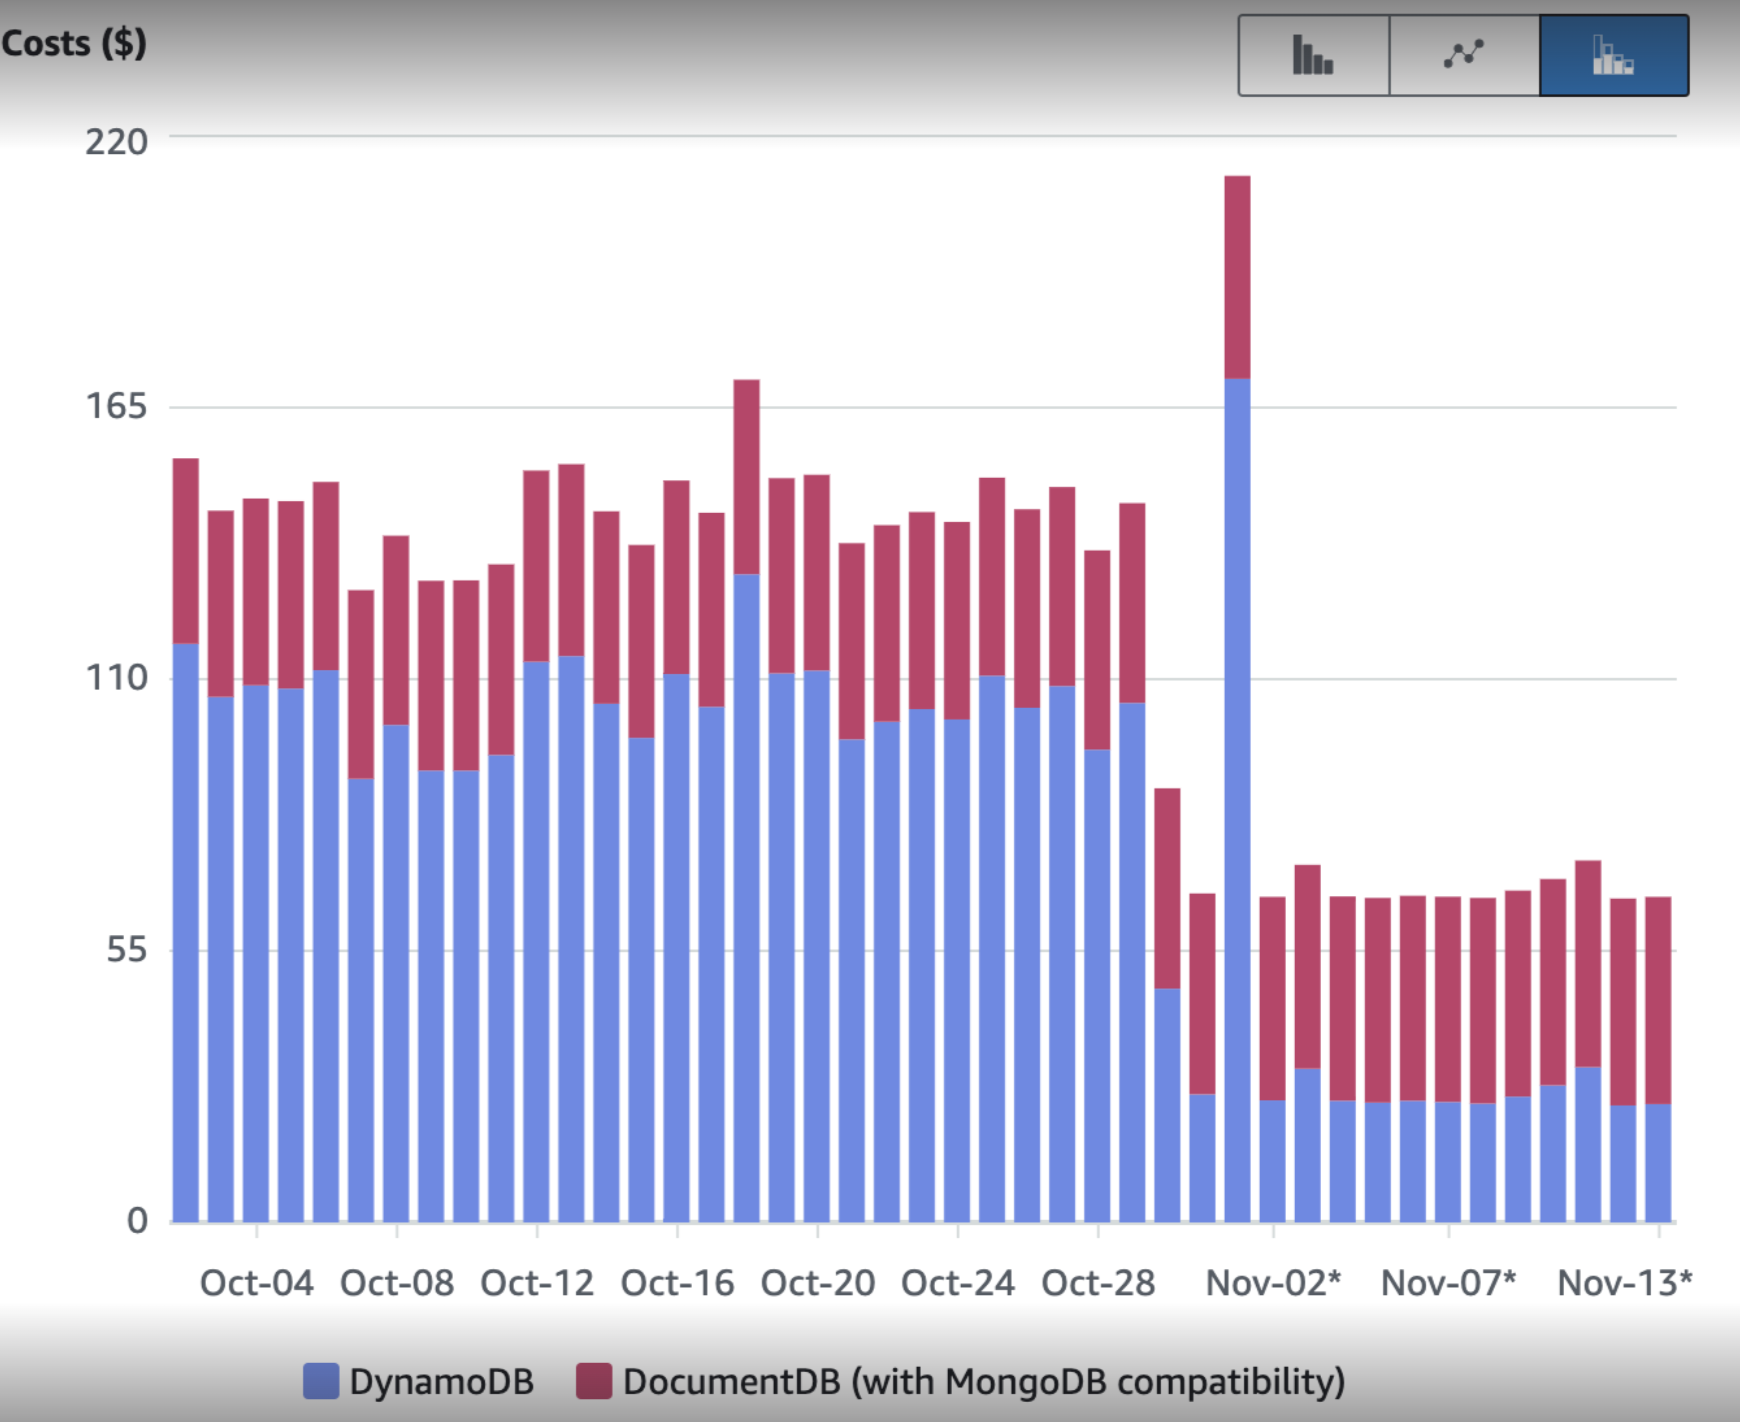
Lastly, DE/DS shutdown selmore v4, releasing the dynamodb tables. Selmore v4 runs on document db, where as selmore v3 was on dynamodb. This has reduced DE cost. Overall, DE account costs have not gone down over what it was 1+ month ago. It became higher when v3, v4 both were running, and not it back to where it was.
New User Approvals:
We have been ramping up batch v6 gradually. We ramped it to 60% early November. Batch v6 delinquencies / approval rates appear to be better than batch v5.
Driven by this and driven by Myntra param based approvals, and perhaps more importantly, heavy intake of NU on Swiggy, since we are spending lot of money on Swiggy, NU delinq projected for Aug, Sep, Oct is trending 9.7%, 9.4%, 8.3% terminal, while NU TPV has increased 2.9 cr, 3.4 cr, 4.3 cr.
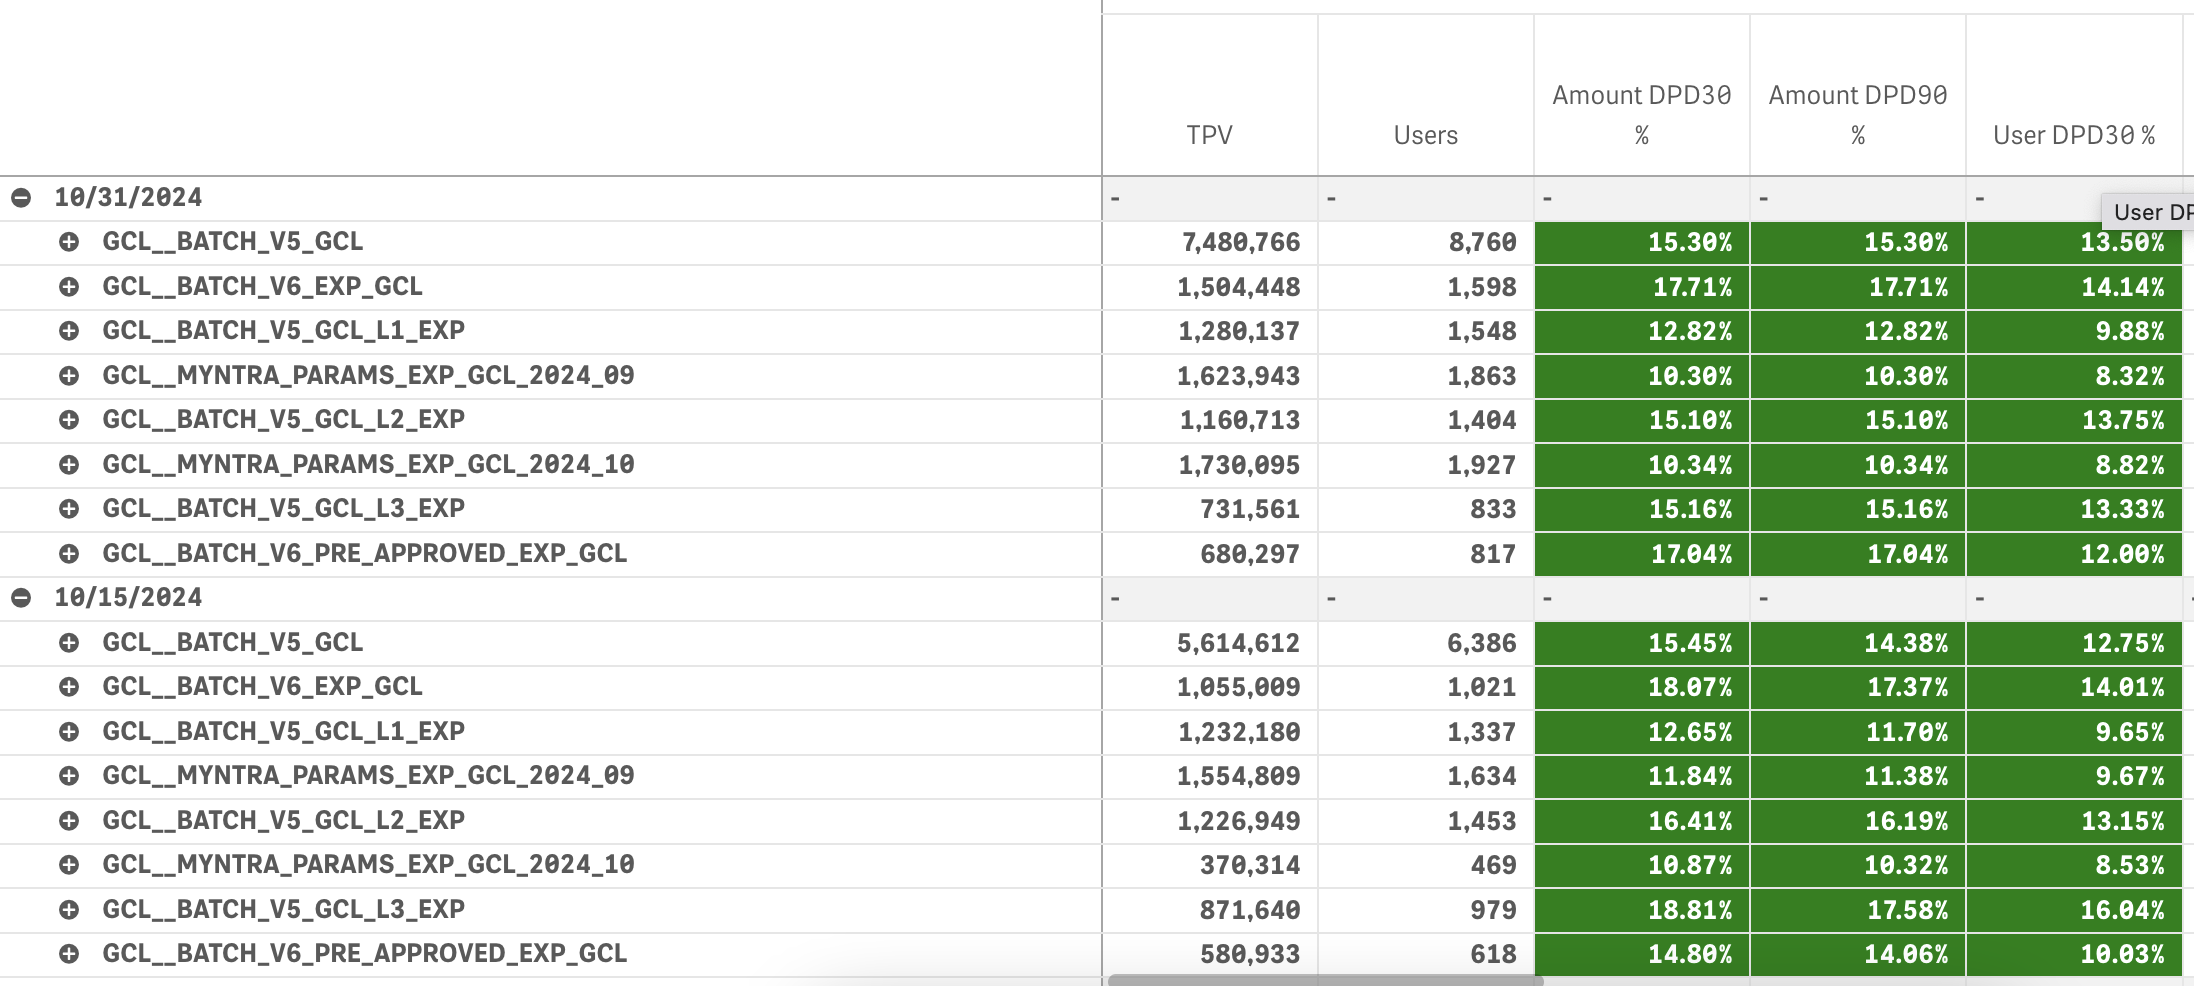 Batch v6 is competitive to batch v5 (though its tenure is smaller). Myntra line delinquencies are lower.
Lot of delinquency decreaes is also because we are acquiring lot of users from Swiggy where delinquencies are lower. Our TPV from Swiggy is higher
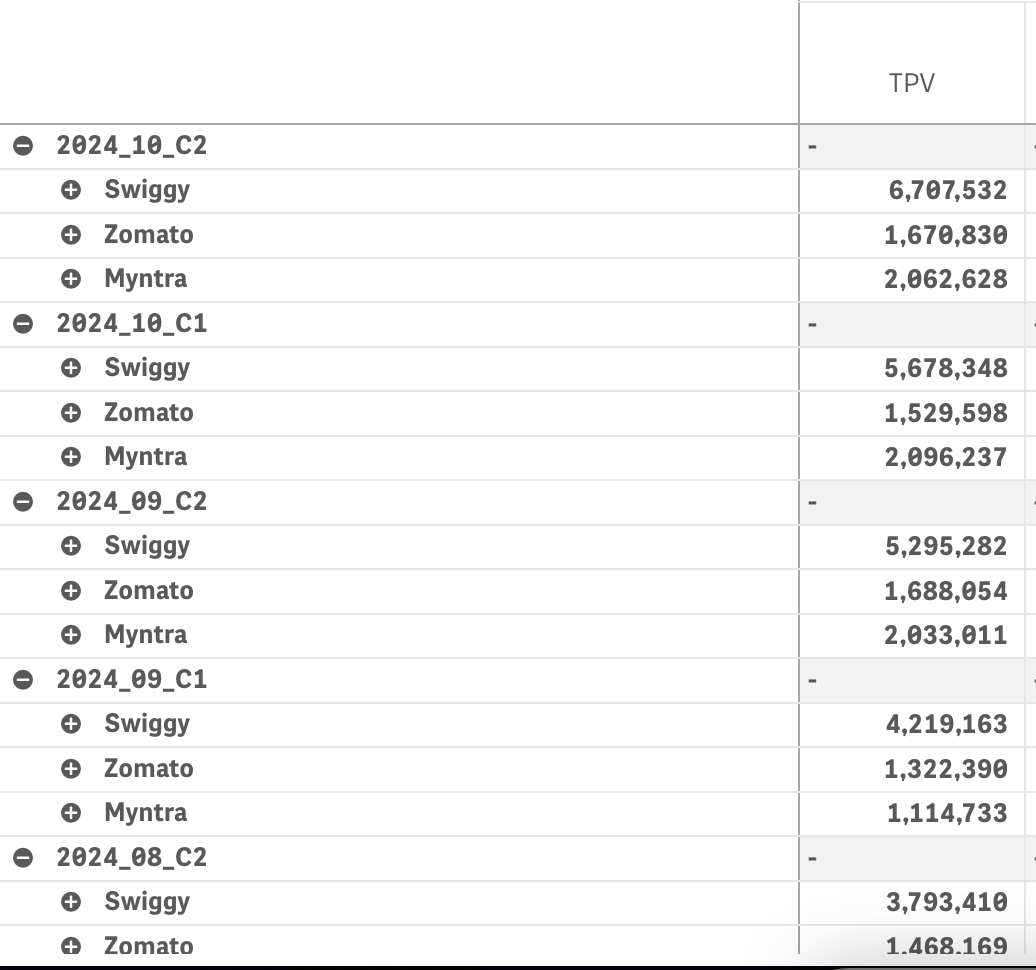
Simultaneously we know that Swiggy NU delinquency is lower:
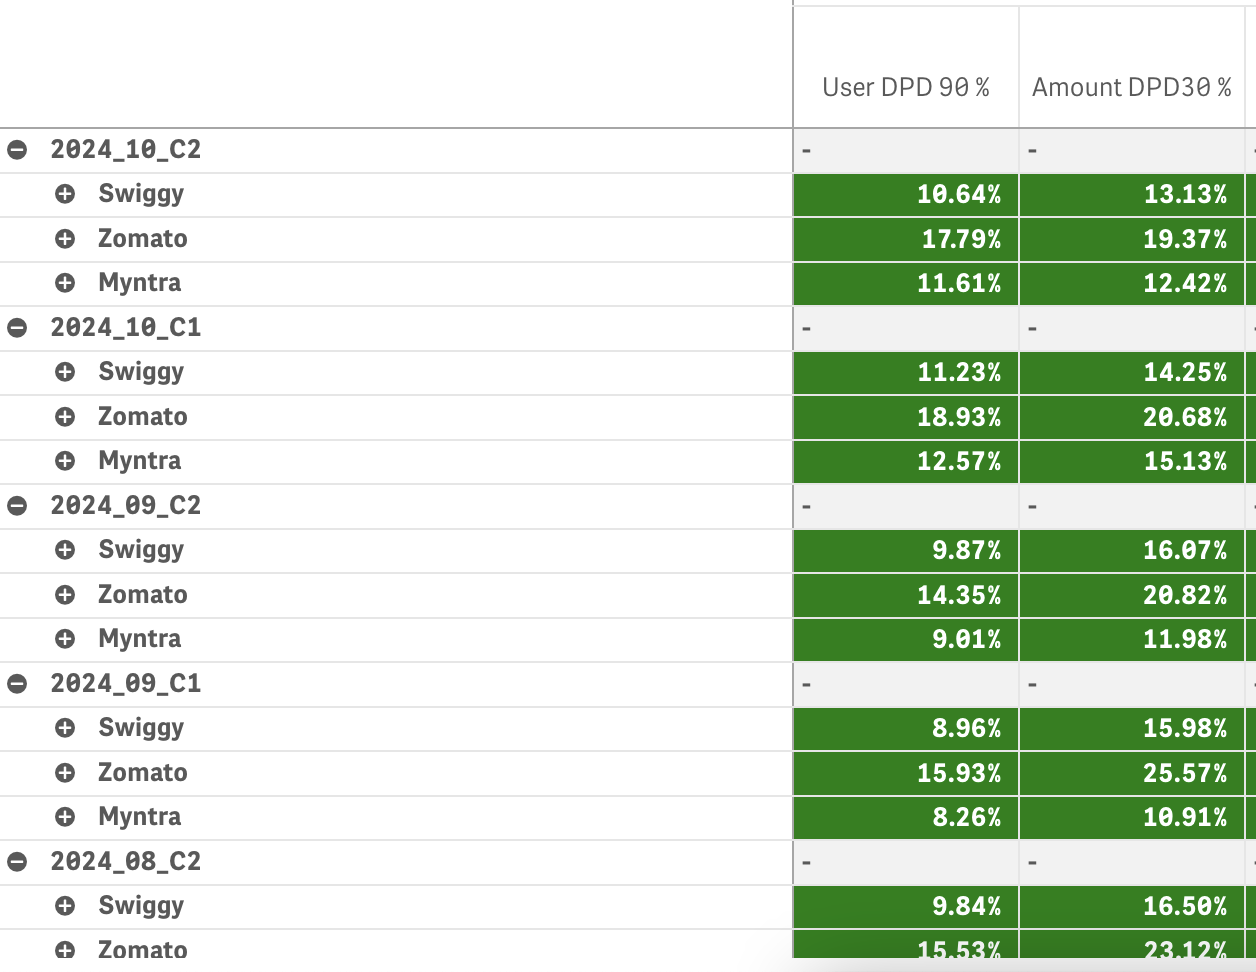 Overall this is leading to lower cycle over cycle delinquencies. So, we expect lower NU delinquencies in Nov and Dec, post which delinquency will rise since Swiggy offers will go away.
We have also lately increased approval rate on Pi3 for UNT users. We to be more systematic about looking at Pi3 approval rates and delinquencies.
Credit Line ManagementLot of experiments related to credit line management have gone live in last ~ 2 months. Following are the experiments.
Selmore blocks have been our workhorse of controlling RU delinquencies. However, blocking users leads to "leaky bucket" too - we spend money to acquire users, and selmore blocks a fraction of them - sometimes highly tenured users.
We are designing an experiment where we deem that selmore is flagging a user because their credit limit has become unsustainable for them. In such case we will reduce credit limit of the user rather than block them.
Churn modelIt looks like exciting work is happening in the area of churn prediction and churn diagnostic, but did not have chance to internalize well what is happening here.
I have spent lot of time this month making several dashboards on databricks. I continue to put rest of the month also in this effort. Next month I have want to do some programming, specifically to see how people program in the world of copilot and all. Let's see if I succeed in doing that.